How to analyze the price chart on the crypto market?
Analyzing charts is a key skill for anyone looking to invest in the cryptocurrency market. Explore some of the key things to look for when analyzing charts on the crypto market.
Analyzing charts is a key skill for anyone looking to invest in the cryptocurrency market. In this article, we'll explore some of the key things to look for when analyzing charts on the crypto market.
Timeframes
The first thing to consider when analyzing charts is the timeframe you're looking at. Depending on your investment strategy, you may be interested in short-term price movements or long-term trends.
For short-term trading, you might look at charts with a timeframe of minutes or hours. For longer-term investments, you might want to look at charts with a timeframe of days, weeks, or even months.
Chart Types
There are several different types of charts that can be used to analyze price movements in the crypto market. Some of the most common types include:
Line Charts: These charts show the price of a cryptocurrency over time as a simple line.
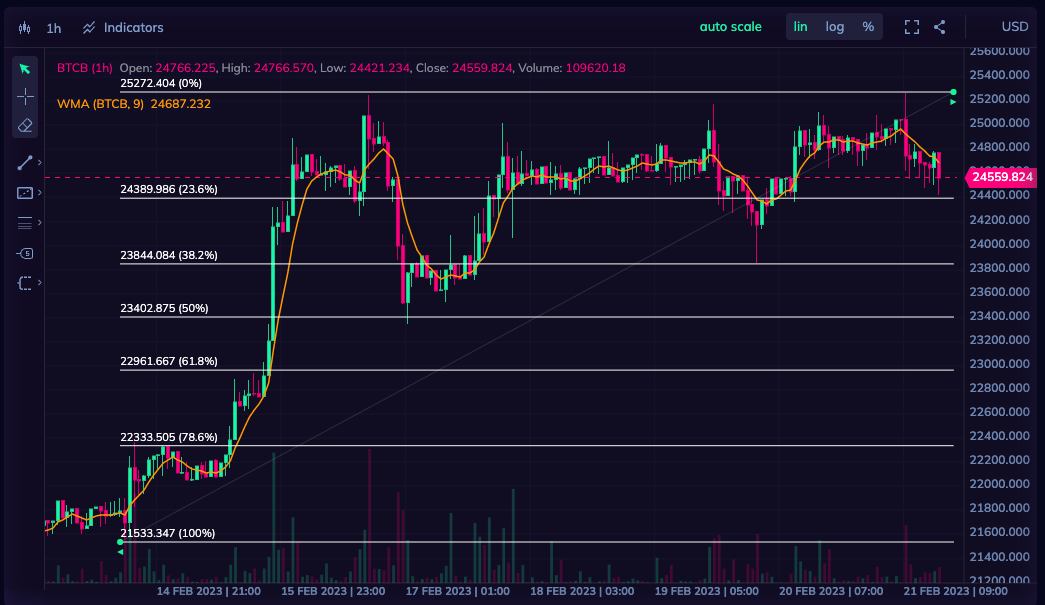
Candlestick Charts: These charts show the price of a cryptocurrency over time as a series of "candles" with a wick on top and bottom representing the high and low of the price and the body of the candle representing the opening and closing price.
Bar Charts: These charts show the price of a cryptocurrency over time as a series of vertical bars.
Technical Indicators
Technical indicators are tools that can be used to help identify trends and potential trading opportunities in the crypto market. Some of the most common technical indicators include:
Moving Averages: These indicators show the average price of a cryptocurrency over a certain period of time, which can help identify trends.
Relative Strength Index (RSI): This indicator compares the average gains and losses of a cryptocurrency over a certain period of time, helping to identify overbought and oversold conditions.
Bollinger Bands: These indicators show the upper and lower bounds of a cryptocurrency's price range over a certain period of time, which can help identify volatility.
Volume
Volume refers to the amount of trading activity in a cryptocurrency. High volume can indicate strong interest in a cryptocurrency, while low volume can indicate a lack of interest.
When analyzing charts, it's important to consider the volume of trading activity along with price movements. High volume and price movements in the same direction can be a strong signal that a trend is developing.
News and Events
Finally, it's important to consider news and events that may impact the crypto market. Factors such as government regulations, adoption by major companies, and security breaches can all have a significant impact on the price of cryptocurrencies.
By staying up to date with the latest news and events, you can make more informed decisions when analyzing charts and making investment decisions.
In conclusion, analyzing charts is an essential skill for anyone looking to invest in the crypto market. By considering factors such as timeframes, chart types, technical indicators, volume, and news and events, you can gain a better understanding of price movements and make more informed investment decisions.